databasedev.co.uk - database solutions and downloads for microsoft access
Microsoft Access Articles
- General Microsoft Access Articles
- Microsoft Access 2007 Articles
- Tables
- Queries
- SQL
- Forms
- Reports
- Macros
- Modules & VBA
- Data Models
- Downloads
GUI Design
Resources
Online Shop
Info
Dashboard Builder for Microsoft Access
Make Your Access Data Come to Life with Dashboard Builder:
Dashboard Builder is one of several Microsoft Access tools OpenGate Software offers. Aimed at anyone that needs to summarize and visualize their Access data, Dashboard Builder helps users to create metrics and graphs and combine them into compact dashboards. Many organizations will find the product a viable alternative to more expensive business intelligence tools, as Dashboard Builder is compatible with any SQL Server or MySQL Server-based system. Dashboard Builder comes in two editions:
Standard Edition
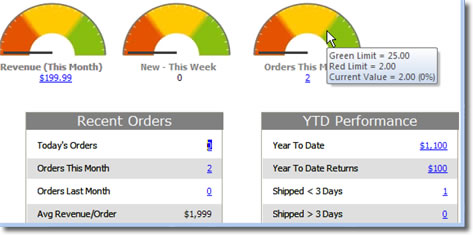
The standard edition of Dashboard Builder lets you create dashboards with four graphic meters and four sections of metrics. You can create as many dashboards as you like, and mix and match your metrics from various data sources. For example, you can create a dashboard that displays specific metrics from different tables or linked databases all in one place.
To define a dashboard, you first need to set up one or more metrics, which are basically definitions of what data the product should fetch from your database. You select the data source (a table or query), then what you want to see in the metric, such as a sum, count, average, minimum, or maximum. Then you specify the relevant field in the table/query, and whether the data should be limited to a specific period of time. OpenGate’s big selling point with this product is that you don’t need to know SQL to create the metrics (although it is supported, and can definitely help if you need some very advanced metrics).
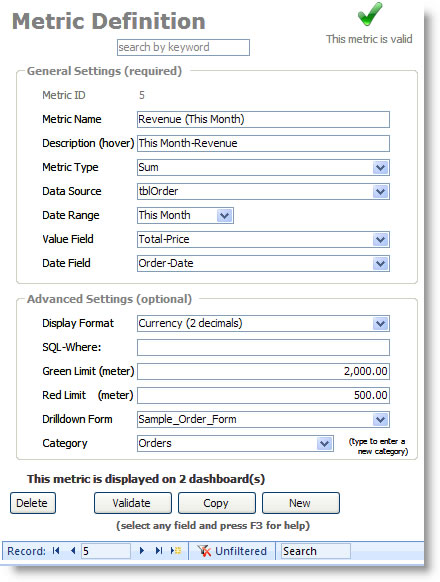
You can also provide some advanced settings for any metric, like a specific SQL where clause (a filter, basically) to limit the records the metric applies to. For example, maybe you want to see order revenue for all but one of your products.
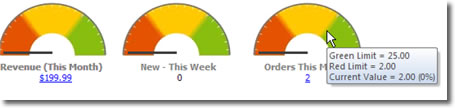
If you want to show the metric as a meter, you put a value in the Green and Red limit fields, and then you can see the metric as a meter. When you hover over, you’ll see those limits, and the current value. Lastly, you can even let users drill down from the dashboard into one of your own forms where the data is visible. When they click on the hyperlink, Dashboard Builder opens your form, and limits the records to just the ones that apply to that metric (like sales orders for this month).
Once you’ve defined all the metrics you want, Dashboard Builder has a simple what-you-see-is-what-you-get (wysiwyg) interface for putting it all together into a single dashboard.
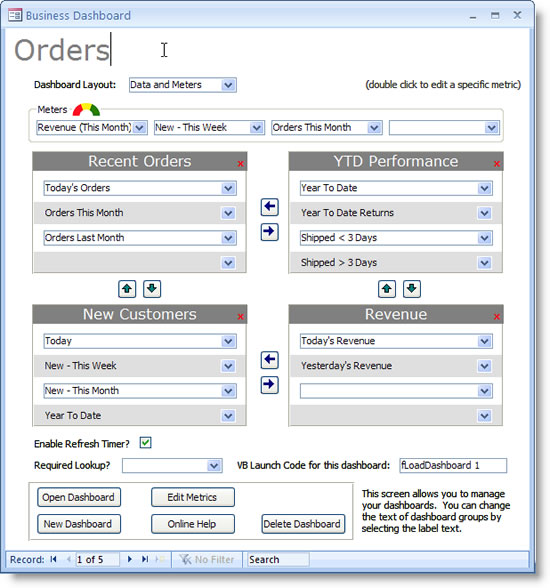
Once you’ve selected all the metrics you want to show on your dashboard, you can open it from the main welcome screen, or use the VB launch code the product provides (a single line you can copy and paste) to open the dashboard.
For more advanced users, OpenGate provides tips and examples on how to embed the meters and metrics into your own forms. And for a limited few, their Alerts feature will come in handy. The Alerts feature lets you use the Green/Red limits for metrics to generate email alerts when one of the metrics is outside your thresholds. For example, if you want a group of people to get an email alert when the number of orders in a day is more than 50.
Professional Edition
The professional edition includes all the features of the standard edition, but then adds graphs. For anyone that has every played with the built in MS Access graph wizard, you know what a pain it can be to work with them. Most people eventually turn to exporting their data from Access to Excel, and creating pivot tables and charts to see the data. But that is where Dashboard Builder really shines. You get to create an unlimited number of chart and graph definitions, and then combine them into their own dashboards.
The graphing setup screen is really simple to use, and you can change your settings and see the changes immediately (another nice improvement over the MS Access chart wizard, where you have to basically start all over if you don’t like how it turns out).
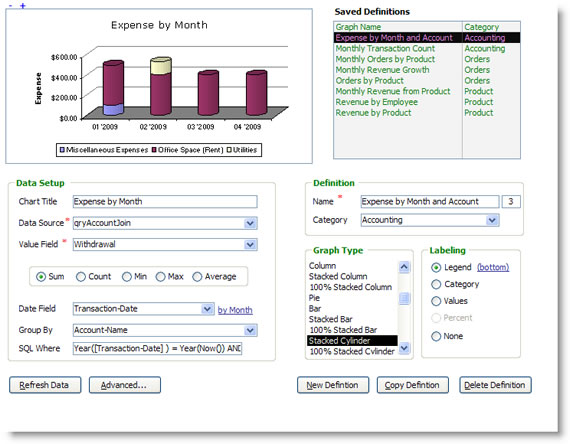
The product supports many different chart types, and you are able to mix and match which graphs you place on any given dashboard.
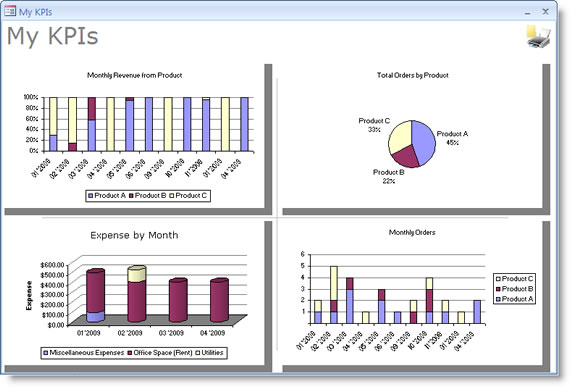
In case you need to share your charts with others, you can copy and paste any graph from Dashboard Builder into Excel, Power Point, or Word. And similar to the standard edition, you can embed graphs into your own forms, and the product comes with several different sizes of graphs in case you want to use something small like a sparkline graph.
In all, a very functional product if you want to visualize your Access data and don’t want to spend a lot of time working with the chart wizard. You can download a 15-day evaluation of Dashboard Builder from OpenGate’s website.